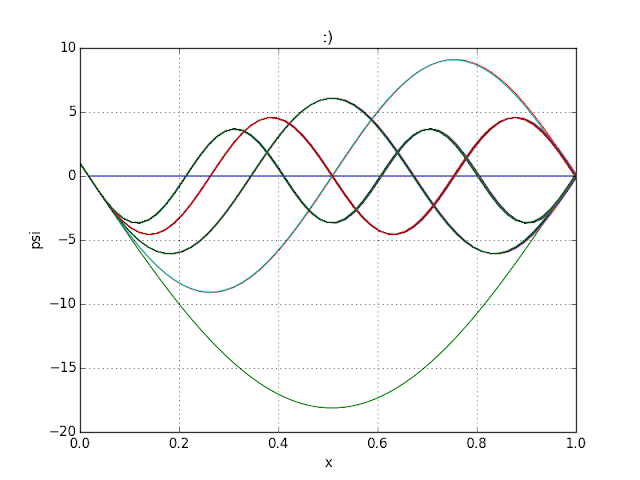
Unlike the code before, only chosen energy with psi=0 on both end is plotted.
from pylab import *

n   = 59
psi0= zeros(n)
psi = psi0
x   = linspace(0,1,n)

psi0[0]  = 1.

plot(x,psi)

t   = 0
dx  = 1./16.
E   = 0.
dE  = .2
V   = 0.
while t< 1337:
    t   += 1
    E   += .01
    k   = 2*dx*dx*(E-V)
    for i in range (1,n-1):
        psi[i+1]  = 2*psi0[i]-psi0[i-1]-k*psi0[i]

    #psi[2:]   = 2*psi0[1:-1]-psi0[:-2]-k*psi0[1:-1]
    psi0    = psi
    #print psi[n-1]
    if abs(psi[n-1])<=dE:
        #pass
        print E
        plot(x,psi)


xlabel('x')
ylabel('psi')
title(':)')
grid(True)
savefig("els.png")
show()


No comments:
Post a Comment